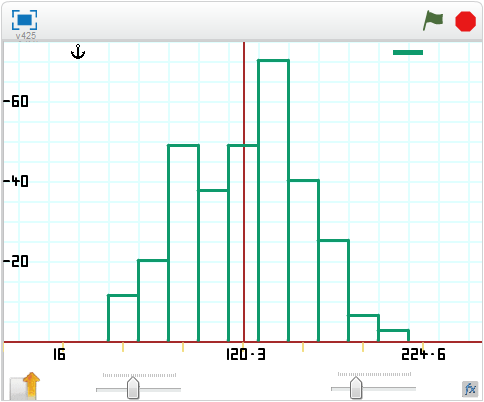
Histo: the program generates data normally distributed (more or less).
The operator types in the target mean, standard deviation and number
of data point. A histogram is drawn. However how does the program
decide the bin/cell widths and where is the first bin starting point – the
anchor point. The operator can then alter the anchor point and bin width.
Does altering either have any bearing on the shape of the histogram and
the conclusions that can be drawn from it?
Sadly in the attempt in schools these are not discussed. I have used this
programme, written in a text based language, with ‘A’ level students
which lead to some interesting discussions about the value of a histogram.